Forecast Sharing
An absolute necessity in supplier integration is true demand information sharing. Demand information could be point-of-consumption data, future demand period forecasts, existing orders, and/or future growth plans. Without this sharing, the supplier is left guessing as to the amount and timing of future demand. Since most reputable suppliers err on the side of providing enough inventory for the worst case, excess inventory is built up at every point where guessing occurs. Demand information sharing eliminates the guesswork in supply chain and inventory planning. Anytime this information is not shared, the supplier must create a forecast of our forecast – significantly proliferating the forecast error leading to excessive inventory or shortages in the chain.
Supply chain ripple effects amplify forecast errors since retailers try to forecast consumer demand patterns, wholesalers try to forecast retailer demand patterns, manufacturers try to forecast wholesaler demand patterns, and suppliers try to forecast manufacturer demand patterns. As each organization creates a new forecast which includes the error factor in the predecessor’s forecast, the forecast error propagates exponentially across the supply chain.
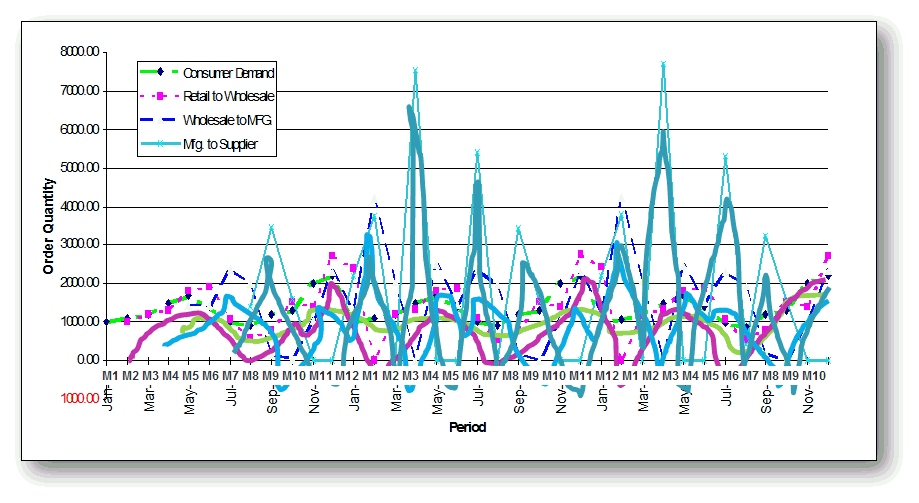
The bullwhip effect is the amplification of order sizes and resulting inventory resulting from poor forecasting, batching for economies of scale, promotions, and shortage gaming in the supply chain. The figure depicts the effect at Campbell’s Soup. The consumer demand for a particular soup SKU is depicted by the bright green line. The demand variability from one week or one month to the next is fairly low; the low being 100 and the high being 200. Retail orders placed by retailers to wholesalers for that same SKU are depicted in the magenta line. Note that the highs are much higher and the lows are much lower. Wholesalers receive this pattern of orders from the retailer.
The wholesaler has to order goods from the manufacturer. That ordering pattern is in royal blue. What do you notice? Again the highs are much higher and the lows are much lower. Lastly, the manufacturer has to order raw materials to cover their demand. Raw material orders are in teal. What do you notice about that demand pattern? The highs are really high, and the lows are really low. When you reach those kind of peaks and valleys in ordering patterns, the inventory levels are much higher than they would be if the ordering pattern variation was significantly smaller.
This is called the Bullwhip Effect. If you take rope or a bullwhip and snap it at one end, you start with a little ripple and that ripple size grows. And by the time you get to the end of the rope you may be at the end of yours.

Supply Chain Bullwhip Effect at Campbell's Soup Company