Shipping Frequency Optimization
Shipping frequencies are a primary determining factor of total transportation costs, inventory carrying costs, transportation administration costs, and customer satisfaction. If we ship less material more frequently (Figure 1) – (1) overall in-transit, lot quantity, and safety stock inventory levels and costs are reduced because there is typically less inventory in-transit at any one time, the recipient is receiving smaller lot quantities, and there are more opportunities to react to shifts in demand or supply streams, (2) transportation administration costs are greater because we have to incur the one-time expense of setting up a shipment for its accompanying paperwork and loading more often, (3) transportation costs are typically higher since we are moving smaller volumes per shipment and not benefiting from transportation discounts associated with large loads, and
(4) customer satisfaction is enhanced since customers are receiving goods more reliably more often.

Figure 1. Impact of Shipping Frequency on Logistics Costs and Performance
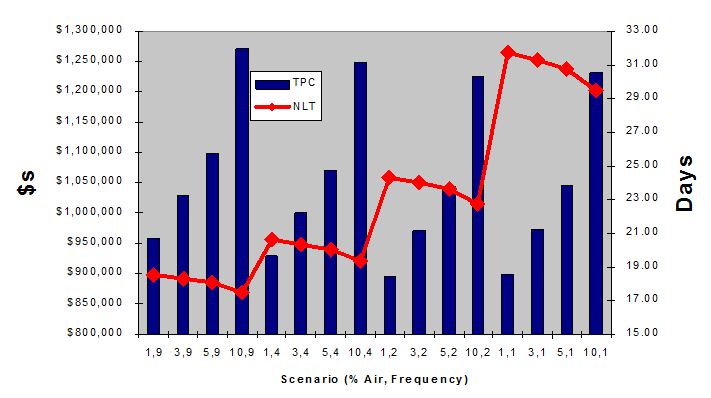
Figure 2. illustrates the results of a recent shipping frequency analysis. In the engagement we were assessing for a global manufacturer/distributor of health and beauty aids the frequency of shipment and the portion of product shipped by air or ocean. (The mode of transportation, like the shipping frequency has a major impact on logistics cost and service.) Air as compared to ocean shipping has much higher freight charges (5x to 10x), much less in-transit inventory, and much shorter cycle times.
In the analysis we considered sixteen shipping scenarios represented by (x,y) pairs where x represents the % shipping by air and y the number of shipments per month. We considered 1%, 3%, 5%, and 10% shipping via air, and 9, 4, 2, and 1 shipments per month to each country in the Asia-Pacific. The analysis compares the total logistics cost (inventory carrying and transportation) of each scenario with the door-to-door delivery cycle times experienced by the countries in the Asia-Pacific. Since the customers in the Asia-Pacific were not willing for their lead times to exceed 24 days, the recommended solution was the scenario yielding the lowest total logistics cost with net lead times less than 24 days. In this case that shipment solution was to ship 1% via air four times per month.
The current air shipping percentage was close to 10% with shipments made eight or nine times per month. The high air shipping percentage and shipment frequency was due primarily to inadequate advance planning capability and insufficient communication links between the U.S. and Far East. The study revealed an opportunity for over $350,000 annual savings by implementing and automating the practices required to implement a (1,4) shipping solution.

Figure 2. Shipping Frequency Analysis